| This Afternoon | Tuesday | Wednesday | Thursday | Friday | Saturday | Sunday |
|---|---|---|---|---|---|---|
| | | | | | | |
| 74° F | 74° F | 81° F | 84° F | 81° F | 76° F | 78° F |
| 13 mph N | 6 mph E | 2 to 6 mph SW | 2 to 8 mph SW | 7 mph NW | 8 mph E | 10 mph NW |
| Sunny | Sunny | Sunny | Mostly Sunny | Partly Sunny | Mostly Sunny | Chance Rain Showers |
| Tonight | Tuesday Night | Wednesday Night | Thursday Night | Friday Night | Saturday Night | |
| | | | | | | |
| 54° F | 57° F | 64° F | 67° F | 62° F | 64° F | |
| 3 to 9 mph N | 5 mph S | 5 mph SW | 7 mph SW | 6 mph NE | 8 mph S | |
| Mostly Clear | Mostly Clear | Partly Cloudy | Slight Chance Rain Showers | Partly Cloudy | Chance Rain Showers |
NO CURRENT WATCHES, WARNINGS, AND ADVISORIES FOR EASTERN BERGEN (NJZ104) NJ
CURRENT WEATHER CONDITIONS IN THE N.Y.C. REGION
The map window below is refreshed every 10 minutes

The weather data shown above comes from MADIS ( Meteorological Assimilation Data Ingest System ). MADIS collates data from federal, state and local agencies and then makes it available for public use. The MADIS data I use comes primarily from the New Jersey Weather and Climate Network and the Automatic Packet Reporting System ( APRS ). The round icons display current temperatures (°F). When the temperature icon equals or exceeds 90°F it turns red. Temperatures at or below 32°F are shown as blue. These stations range from Ocean City, Maryland to Provincetown, Massachusetts. This map was created primarily to help track the rain / snow line ( the 32°F isotherm ) as winter northeasters move up along the coast. It is also possible to see the cooling effect of sea breezes on coastal sites during the summer. Additional weather data for each station can be accessed in a pop-up table by clicking on the round temperature icons. These data are updated every 10 minutes.
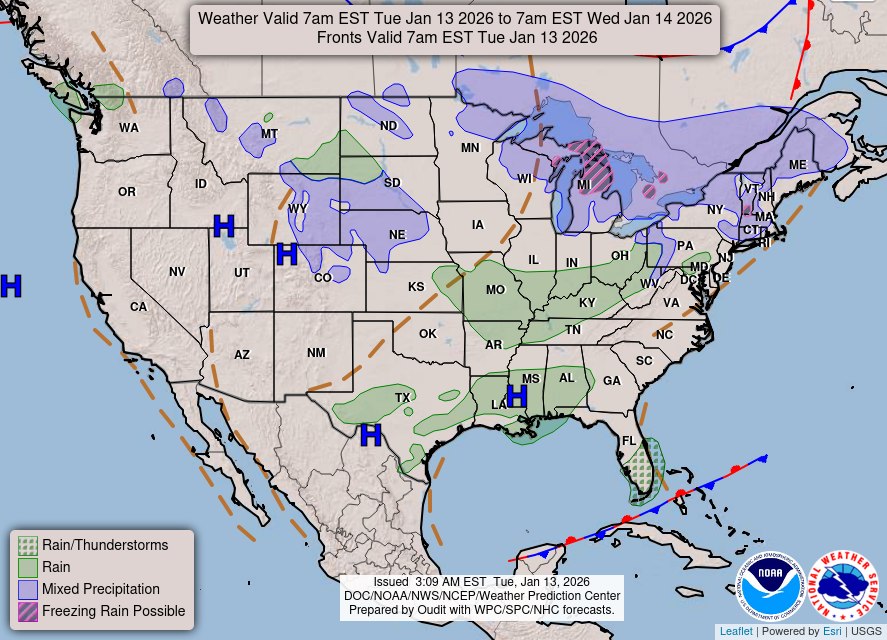
THE DAILY WEATHER MAP
WEATHER SUMMARY FOR AUGUST 2026
A WARM AND WET MONTH
The average temperature this past August in Bergenfield was 76.3°F (24.6°C). This is
1.4°F (0.8°C) above the long-term mean.
A maximum temperature of 95°F (35.0°C) was reached on the 7th. The minimum
of 60°F (15.6°C) was recorded on the 25th and 29th. Smoke and haze from
Canadian wildfires occasionally overspread the region during the first half of the month.
Precipitation was well above normal at 6.68" (169.7mm)... about 2.25" more than
what we usually receive in August. The 1.93" (49.0mm) that fell on the 20th set a
new daily record. The precipitation shortfall that we have been experiencing over the past year
is slowly ending. The current shortfall is slightly less than 3 inches.
A heatwave visited the region with maximum temperatures above 90°F from the 6th through
the 10th.